Template:Infobox spaceflight Template:Physical cosmology
The Wilkinson Microwave Anisotropy Probe (WMAP), originally known as the Microwave Anisotropy Probe (MAP) was a spacecraft operating from 2001 to 2010 which measured differences across the sky in the temperature of the cosmic microwave background (CMB) – the radiant heat remaining from the Big Bang.[1][2] Headed by Professor Charles L. Bennett of Johns Hopkins University, the mission was developed in a joint partnership between the NASA Goddard Space Flight Center and Princeton University.[3] The WMAP spacecraft was launched on June 30, 2001 from Florida. The WMAP mission succeeded the COBE space mission and was the second medium-class (MIDEX) spacecraft in the NASA Explorers program. In 2003, MAP was renamed WMAP in honor of cosmologist David Todd Wilkinson (1935–2002),[3] who had been a member of the mission's science team. After 9 years of operations, WMAP was switched off in 2010, following the launch of the more advanced Planck spacecraft by ESA in 2009.
WMAP's measurements played a key role in establishing the current Standard Model of Cosmology: the Lambda-CDM model. The WMAP data are very well fit by a universe that is dominated by dark energy in the form of a cosmological constant. Other cosmological data are also consistent, and together tightly constrain the Model. In the Lambda-CDM model of the universe, the age of the universe is Template:Val billion years. The WMAP mission's determination of the age of the universe to better than 1% precision was recognized by the Guinness Book of World Records.[4] The current expansion rate of the universe is (see Hubble constant) of Template:Val. The content of the universe presently consists of Template:Val ordinary baryonic matter; Template:Val Cold dark matter (CDM) that neither emits nor absorbs light; and Template:Val of dark energy in the form of a cosmological constant that accelerates the expansion of the universe.[5] Less than 1% of the current contents of the universe is in neutrinos, but WMAP's measurements have found, for the first time in 2008, that the data prefers the existence of a cosmic neutrino background[6] with an effective number of neutrino species of Template:Val. The contents point to a Euclidean flat geometry, with curvature () of Template:Val. The WMAP measurements also support the cosmic inflation paradigm in several ways, including the flatness measurement.

The mission has won various awards: according to Science magazine, the WMAP was the Breakthrough of the Year for 2003.[7] This mission's results papers were first and second in the "Super Hot Papers in Science Since 2003" list.[8] Of the all-time most referenced papers in physics and astronomy in the INSPIRE-HEP database, only three have been published since 2000, and all three are WMAP publications. Bennett, Lyman A. Page, Jr., and David N. Spergel, the latter both of Princeton University, shared the 2010 Shaw Prize in astronomy for their work on WMAP.[9] Bennett and the WMAP science team were awarded the 2012 Gruber Prize in cosmology.
As of October 2010, the WMAP spacecraft is derelict in a heliocentric graveyard orbit after 9 years of operations.[10] All WMAP data are released to the public and have been subject to careful scrutiny. The final official data release was the nine-year release in 2012.[11][12]
Some aspects of the data are statistically unusual for the Standard Model of Cosmology. For example, the largest angular-scale measurement, the quadrupole moment, is somewhat smaller than the Model would predict, but this discrepancy is not highly significant.[13] A large cold spot and other features of the data are more statistically significant, and research continues into these.
Objectives[]

The universe's timeline, from inflation to the WMAP.
The WMAP objective is to measure the temperature differences in the Cosmic Microwave Background (CMB) radiation. The anisotropies then are used to measure the universe's geometry, content, and evolution; and to test the Big Bang model, and the cosmic inflation theory.[14] For that, the mission is creating a full-sky map of the CMB, with a 13 arcminute resolution via multi-frequency observation. The map requires the fewest systematic errors, no correlated pixel noise, and accurate calibration, to ensure angular-scale accuracy greater than its resolution.[14] The map contains 3,145,728 pixels, and uses the HEALPix scheme to pixelize the sphere.[15] The telescope also measures the CMB's E-mode polarization,[14] and foreground polarization;[6] its life is 27 months; 3 to reach the Template:L2 position, 2 years of observation.[14]
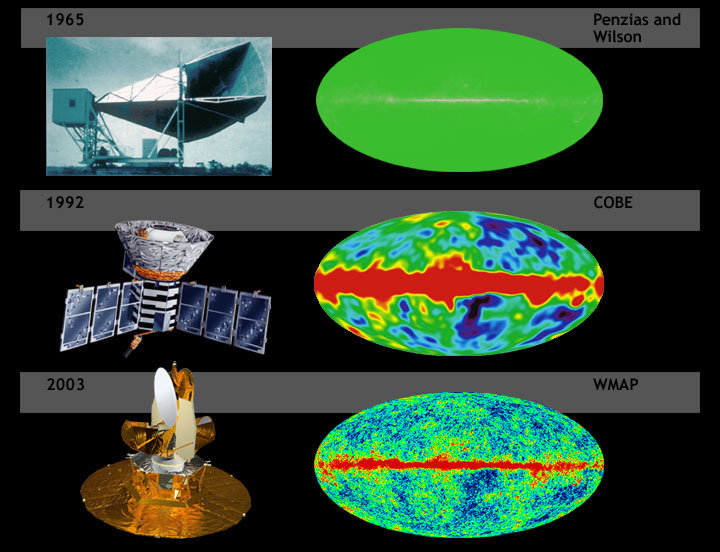
A comparison of the sensitivity of WMAP with COBE and Penzias and Wilson's telescope. Simulated data.
Development[]
The MAP mission was proposed to NASA in 1995, selected for definition study in 1996, and approved for development in 1997.[16][17]
The WMAP was preceded by two missions to observe the CMB; (i) the Soviet RELIKT-1 that reported the upper-limit measurements of CMB anisotropies, and (ii) the U.S. COBE satellite that first reported large-scale CMB fluctuations. The WMAP is 45 times more sensitive, with 33 times the angular resolution of its COBE satellite predecessor.[18] The successor European Planck mission (operational 2009-2013) had a higher resolution and higher sensitivity than WMAP and observed in 9 frequency bands rather than WMAP's 5, allowing improved astrophysical foreground models.
Spacecraft[]
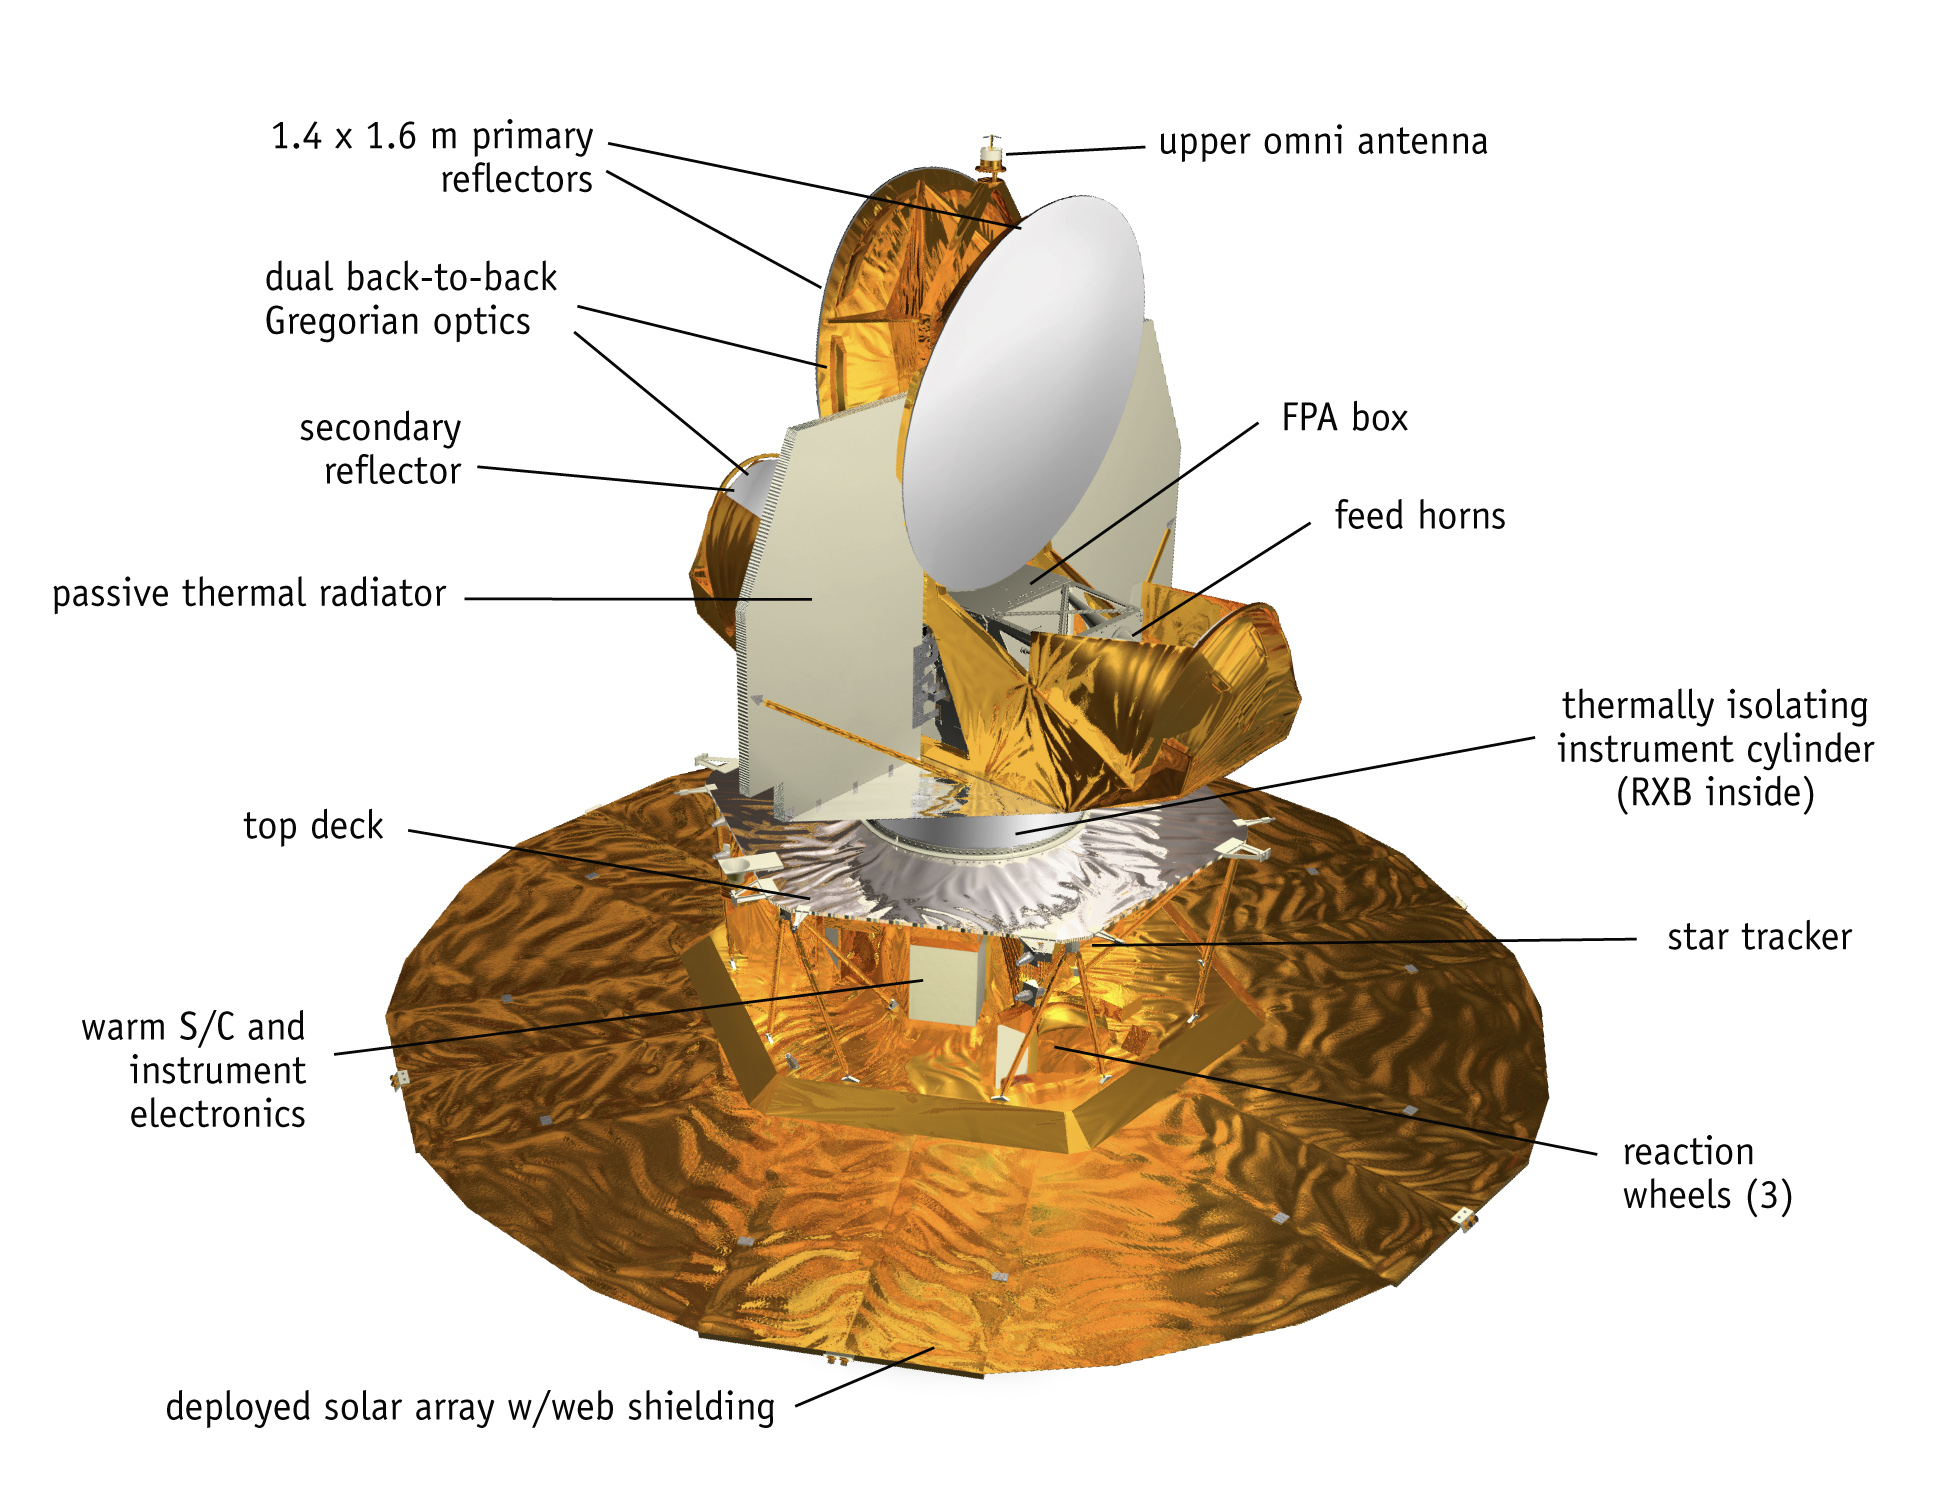
WMAP spacecraft diagram
The telescope's primary reflecting mirrors are a pair of Gregorian 1.4m x 1.6m dishes (facing opposite directions), that focus the signal onto a pair of 0.9m x 1.0m secondary reflecting mirrors. They are shaped for optimal performance: a carbon fibre shell upon a Korex core, thinly-coated with aluminium and silicon oxide. The secondary reflectors transmit the signals to the corrugated feedhorns that sit on a focal plane array box beneath the primary reflectors.[14]

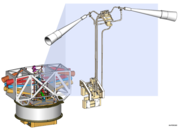
Illustration of WMAP's receivers
The receivers are polarization-sensitive differential radiometers measuring the difference between two telescope beams. The signal is amplified with HEMT low-noise amplifiers, built by the National Radio Astronomy Observatory. There are 20 feeds, 10 in each direction, from which a radiometer collects a signal; the measure is the difference in the sky signal from opposite directions. The directional separation azimuth is 180 degrees; the total angle is 141 degrees.[14] To avoid collecting Milky Way galaxy foreground signals, the WMAP uses five discrete radio frequency bands, from 23 GHz to 94 GHz.[14]
| Property | K-band | Ka-band | Q-band | V-band | W-band |
|---|---|---|---|---|---|
| Central wavelength (mm) | 13 | 9.1 | 7.3 | 4.9 | 3.2 |
| Central frequency (GHz) | 23 | 33 | 41 | 61 | 94 |
| Bandwidth (GHz) | 5.5 | 7.0 | 8.3 | 14.0 | 20.5 |
| Beam size (arcminutes) | 52.8 | 39.6 | 30.6 | 21 | 13.2 |
| Number of radiometers | 2 | 2 | 4 | 4 | 8 |
| System temperature (K) | 29 | 39 | 59 | 92 | 145 |
| Sensitivity (mK s) | 0.8 | 0.8 | 1.0 | 1.2 | 1.6 |

The WMAP's base is a 5.0m-diameter solar panel array that keeps the instruments in shadow during CMB observations, (by keeping the craft constantly angled at 22 degrees, relative to the Sun). Upon the array sit a bottom deck (supporting the warm components) and a top deck. The telescope's cold components: the focal-plane array and the mirrors, are separated from the warm components with a cylindrical, 33 cm-long thermal isolation shell atop the deck.[14]
Passive thermal radiators cool the WMAP to ca. 90 degrees K; they are connected to the low-noise amplifiers. The telescope consumes 419 W of power. The available telescope heaters are emergency-survival heaters, and there is a transmitter heater, used to warm them when off. The WMAP spacecraft's temperature is monitored with platinum resistance thermometers.[14]
The WMAP's calibration is effected with the CMB dipole and measurements of Jupiter; the beam patterns are measured against Jupiter. The telescope's data are relayed daily via a 2 GHz transponder providing a 667kbit/s downlink to a 70m Deep Space Network telescope. The spacecraft has two transponders, one a redundant back-up; they are minimally active – ca. 40 minutes daily – to minimize radio frequency interference. The telescope's position is maintained, in its three axes, with three reaction wheels, gyroscopes, two star trackers and sun sensors, and is steered with eight hydrazine thrusters.[14]
Launch, trajectory, and orbit[]


The WMAP's trajectory and orbit.
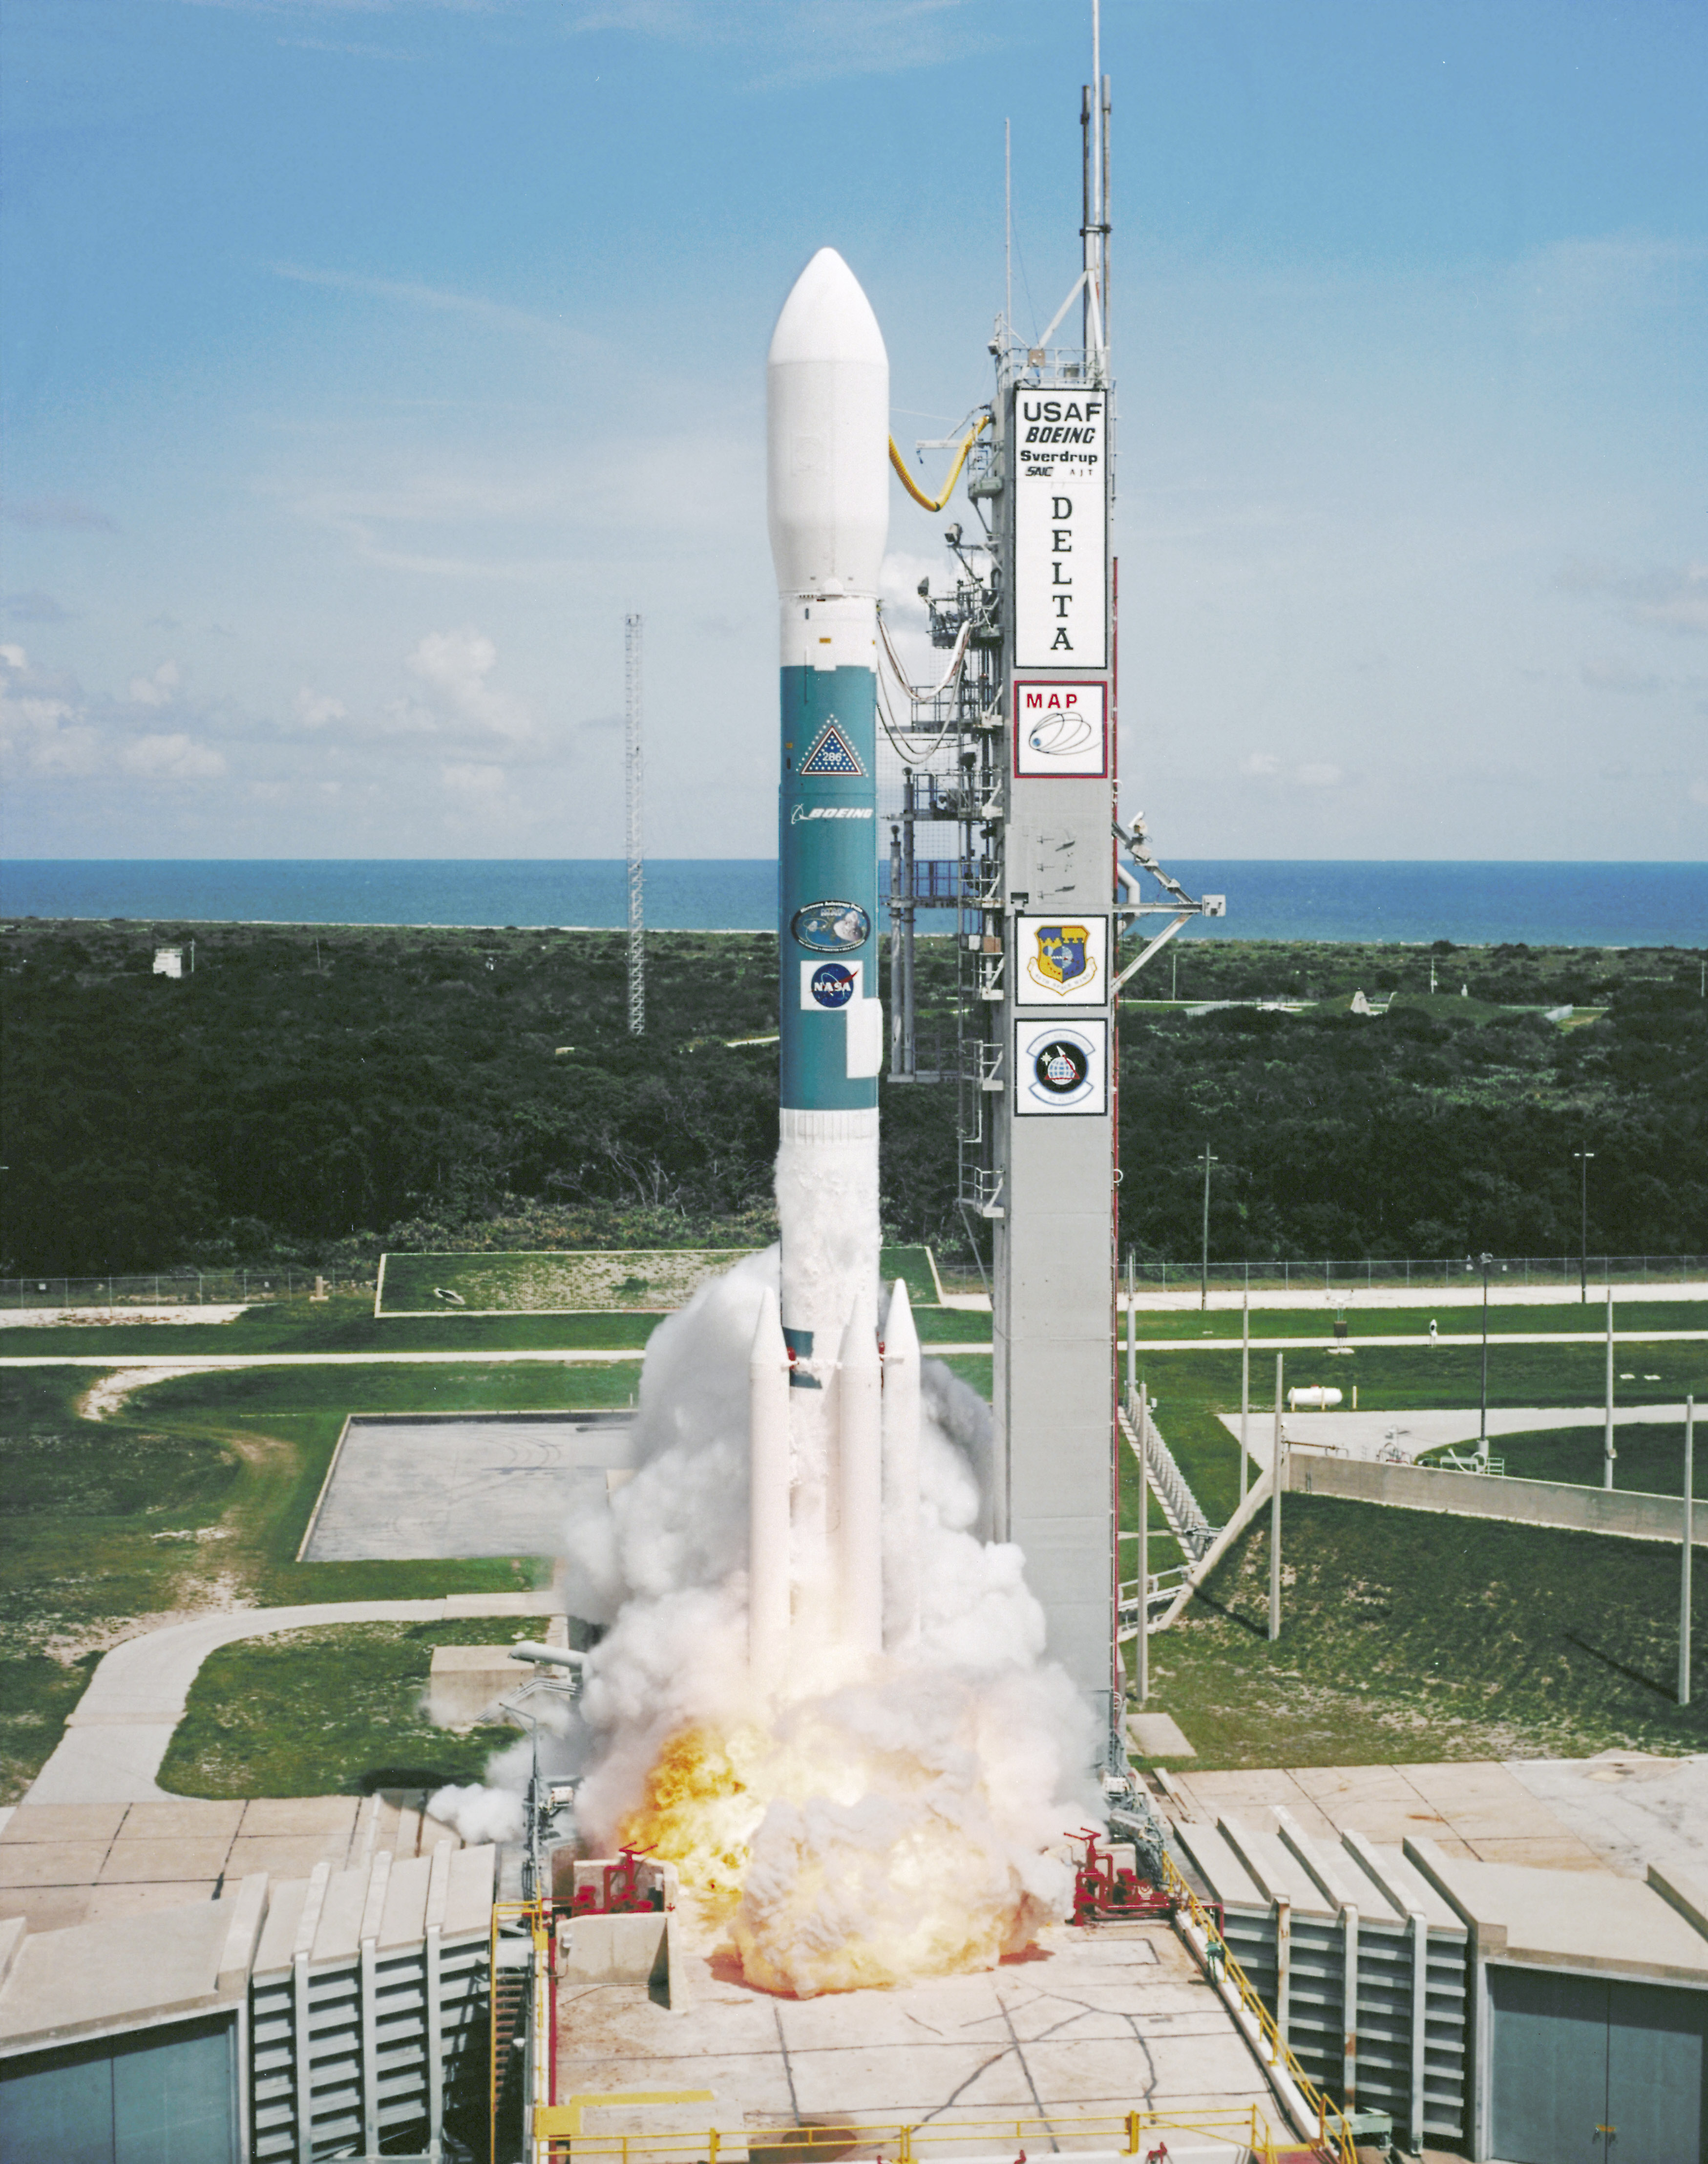

WMAP launches from Kennedy Space Center, June 30, 2001.
The WMAP spacecraft arrived at the Kennedy Space Center on April 20, 2001. After being tested for two months, it was launched via Delta II 7425 rocket on June 30, 2001.[16][18] It began operating on its internal power five minutes before its launching, and so continued operating until the solar panel array deployed. The WMAP was activated and monitored while it cooled. On July 2, it began working, first with in-flight testing (from launching until August 17), then began constant, formal work.[18] Afterwards, it effected three Earth-Moon phase loops, measuring its sidelobes, then flew by the Moon on July 30, en route to the Sun-Earth Template:L2 Lagrangian point, arriving there on October 1, 2001, becoming, thereby, the first CMB observation mission permanently posted there.[16]
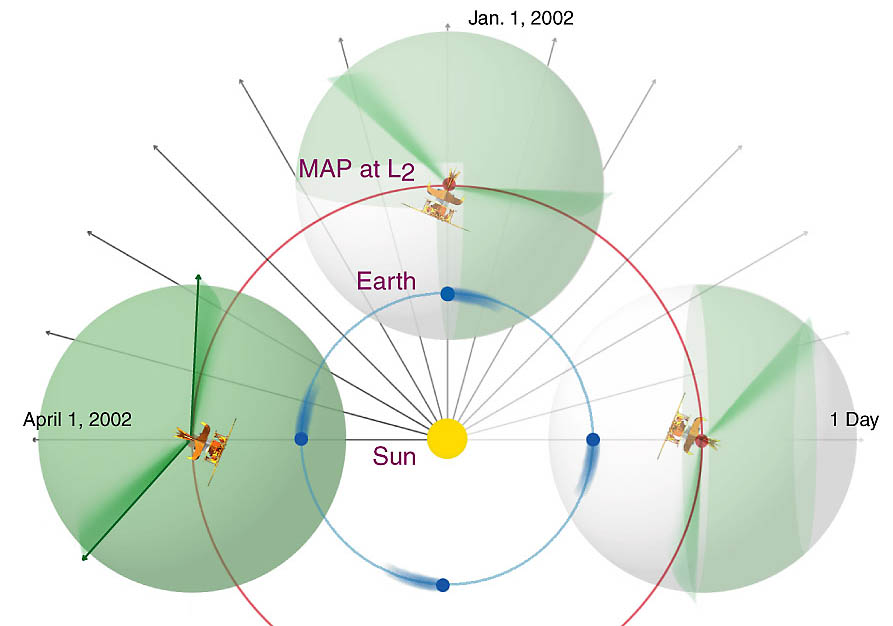
WMAP's orbit and sky scan strategy
The spacecraft's location at Lagrange 2, (1.5 million kilometers from Earth) minimizes the amount of contaminating solar, terrestrial, and lunar emissions registered, and thermally stabilizes it. To view the entire sky, without looking to the Sun, the WMAP traces a path around Template:L2 in a Lissajous orbit ca. 1.0 degree to 10 degrees,[14] with a 6-month period.[16] The telescope rotates once every 2 minutes, 9 seconds" (0.464 rpm) and precesses at the rate of 1 revolution per hour.[14] WMAP measures the entire sky every six months, and completed its first, full-sky observation in April 2002.[17]
Foreground radiation subtraction[]
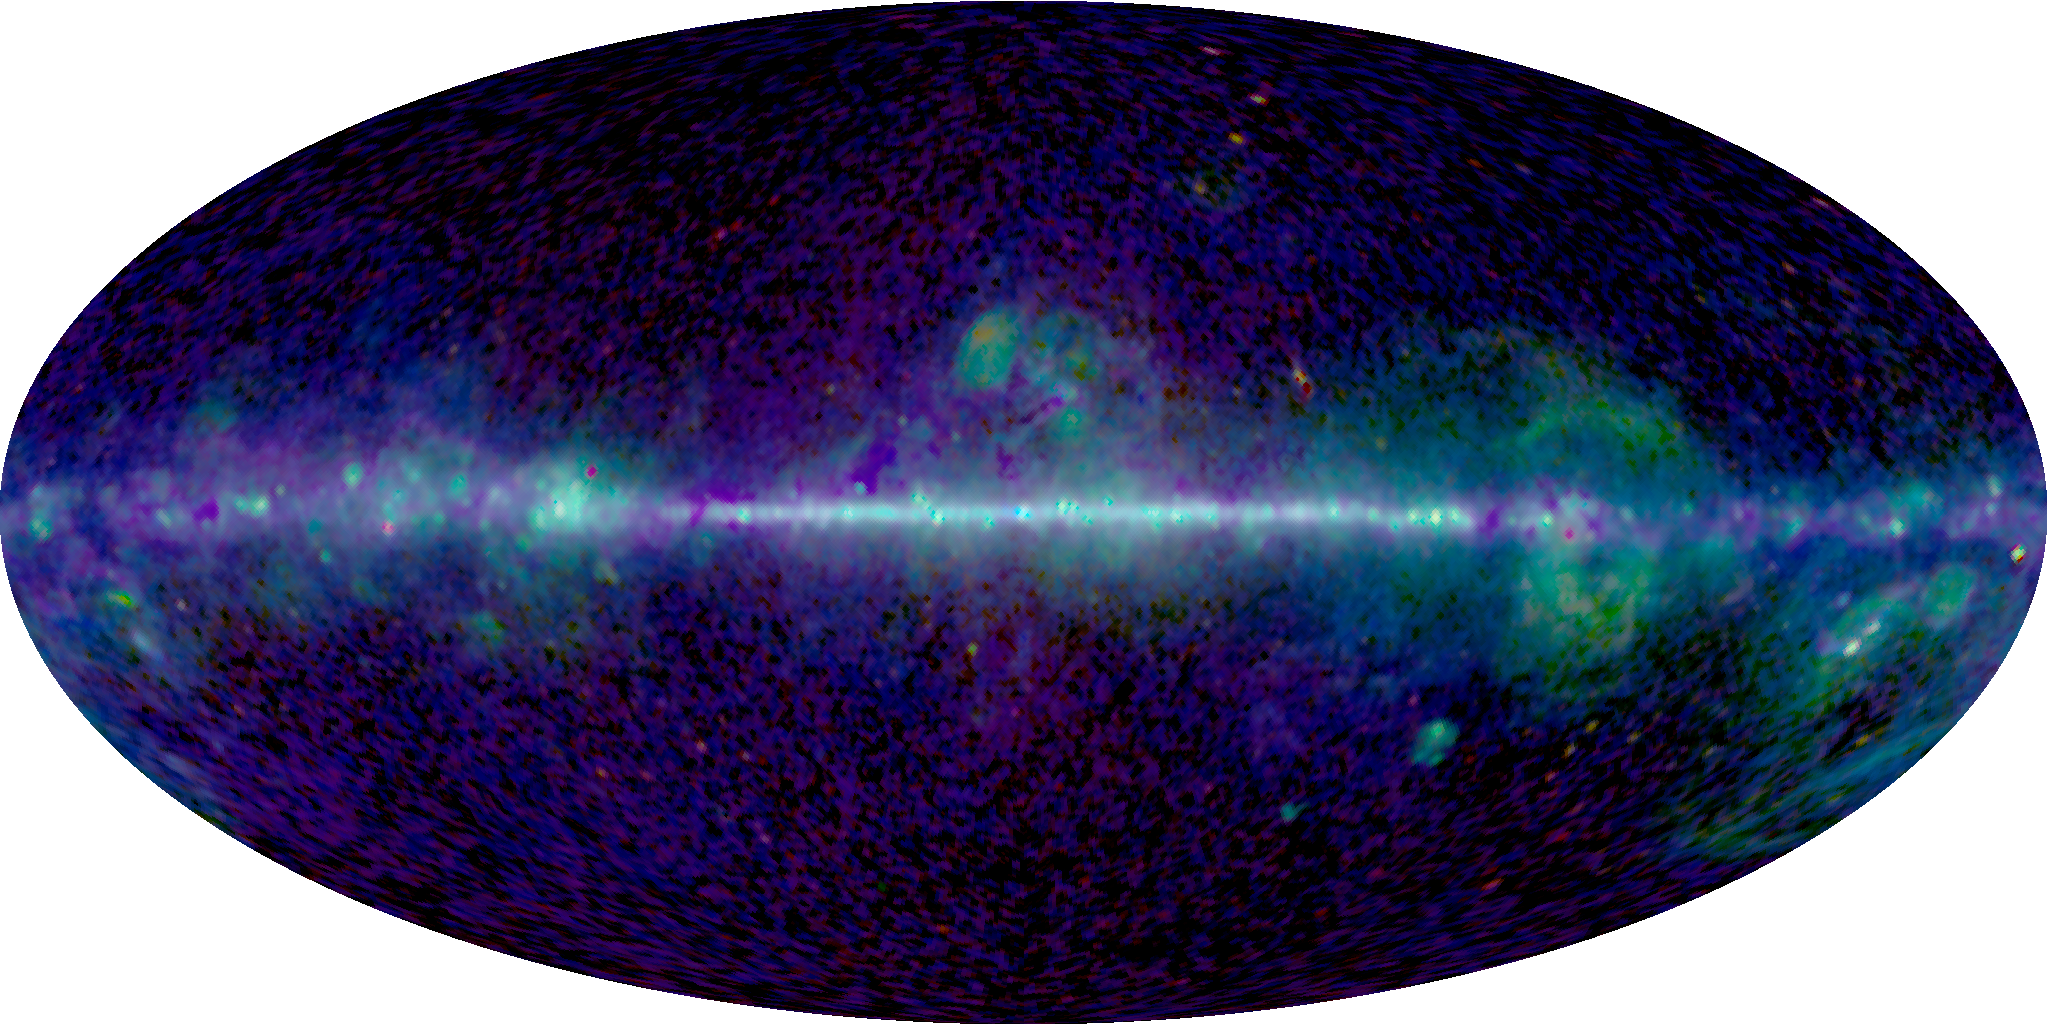
The WMAP observes in five frequencies, permitting the measurement and subtraction of foreground contamination (from the Milky Way and extra-galactic sources) of the CMB. The main emission mechanisms are synchrotron radiation and free-free emission (dominating the lower frequencies), and astrophysical dust emissions (dominating the higher frequencies). The spectral properties of these emissions contribute different amounts to the five frequencies, thus permitting their identification and subtraction.[14]
Foreground contamination is removed in several ways. First, subtract extant emission maps from the WMAP's measurements; second, use the components' known spectral values to identify them; third, simultaneously fit the position and spectra data of the foreground emission, using extra data sets. Foreground contamination also is reduced by using only the full-sky map portions with the least foreground contamination, whilst masking the remaining map portions.[14]
 |
 |
 |
 |
|
| 23 GHz | 33 GHz | 41 GHz | 61 GHz | 94 GHz |
Measurements and discoveries[]
One-year data release[]


1 year WMAP image of background cosmic radiation (2003).
On February 11, 2003, NASA published the First-year's worth of WMAP data. The latest calculated age and composition of the early universe were presented. In addition, an image of the early universe, that "contains such stunning detail, that it may be one of the most important scientific results of recent years" was presented. The newly released data surpass previous CMB measurements.[3]
Based upon the Lambda-CDM model, the WMAP team produced cosmological parameters from the WMAP's first-year results. Three sets are given below; the first and second sets are WMAP data; the difference is the addition of spectral indices, predictions of some inflationary models. The third data set combines the WMAP constraints with those from other CMB experiments (ACBAR and CBI), and constraints from the 2dF Galaxy Redshift Survey and Lyman alpha forest measurements. Note that there are degenerations among the parameters, the most significant is between and ; the errors given are at 68% confidence.[19]


| Parameter | Symbol | Best fit (WMAP only) | Best fit (WMAP, extra parameter) | Best fit (all data) |
|---|---|---|---|---|
| Age of the universe (Ga) | Template:Val | – | Template:Val | |
| Hubble's constant ( Template:Frac ) | Template:Val | Template:Val | Template:Val | |
| Baryonic content | Template:Val | Template:Val | Template:Val | |
| Matter content | Template:Val | Template:Val | Template:Val | |
| Optical depth to reionization | Template:Val | Template:Val | Template:Val | |
| Amplitude | A | Template:Val | Template:Val | Template:Val |
| Scalar spectral index | Template:Val | Template:Val | Template:Val | |
| Running of spectral index | — | Template:Val | Template:Val | |
| Fluctuation amplitude at 8h−1 Mpc | Template:Val | — | Template:Val | |
| Total density of the universe | – | – | Template:Val |


Using the best-fit data and theoretical models, the WMAP team determined the times of important universal events, including the redshift of reionization, Template:Val; the redshift of decoupling, Template:Val (and the universe's age at decoupling, Template:Val); and the redshift of matter/radiation equality, Template:Val. They determined the thickness of the surface of last scattering to be Template:Val in redshift, or Template:Val. They determined the current density of baryons, Template:Val, and the ratio of baryons to photons, Template:Val. The WMAP's detection of an early reionization excluded warm dark matter.[19]
The team also examined Milky Way emissions at the WMAP frequencies, producing a 208-point source catalogue. Also, they observed the Sunyaev-Zel'dovich effect at 2.5 σ the strongest source is the Coma cluster.[15]
Three-year data release[]


3-year WMAP image of background cosmic radiation (2006).
The Three-year WMAP data were released on March 17, 2006. The data included temperature and polarization measurements of the CMB, which provided further confirmation of the standard flat Lambda-CDM model and new evidence in support of inflation.
The 3-year WMAP data alone shows that the universe must have dark matter. Results were computed both only using WMAP data, and also with a mix of parameter constraints from other instruments, including other CMB experiments (ACBAR, CBI and BOOMERANG), SDSS, the 2dF Galaxy Redshift Survey, the Supernova Legacy Survey and constraints on the Hubble constant from the Hubble Space Telescope.[20]
| Parameter | Symbol | Best fit (WMAP only) |
|---|---|---|
| Age of the universe (Ga) | Template:Val | |
| Hubble's constant ( Template:Frac ) | Template:Val | |
| Baryonic content | Template:Val | |
| Matter content | Template:Val | |
| Optical depth to reionization Template:Ref | Template:Val | |
| Scalar spectral index | Template:Val | |
| Fluctuation amplitude at 8h−1 Mpc | Template:Val | |
| Tensor-to-scalar ratio Template:Ref | r | < 0.65 |
[a] Template:Note Optical depth to reionization improved due to polarization measurements.[21]
[b] Template:Note < 0.30 when combined with SDSS data. No indication of non-gaussianity.[20]
Five-year data release[]


5-year WMAP image of background cosmic radiation (2008).
The Five-year WMAP data were released on February 28, 2008. The data included new evidence for the cosmic neutrino background, evidence that it took over half a billion years for the first stars to reionize the universe, and new constraints on cosmic inflation.[22] Template:Multiple image The improvement in the results came from both having an extra 2 years of measurements (the data set runs between midnight on August 10, 2001 to midnight of August 9, 2006), as well as using improved data processing techniques and a better characterization of the instrument, most notably of the beam shapes. They also make use of the 33 GHz observations for estimating cosmological parameters; previously only the 41 GHz and 61 GHz channels had been used. Finally, improved masks were used to remove foregrounds.[6]
Improvements to the spectra were in the 3rd acoustic peak, and the polarization spectra.[6]
The measurements put constraints on the content of the universe at the time that the CMB was emitted; at the time 10% of the universe was made up of neutrinos, 12% of atoms, 15% of photons and 63% dark matter. The contribution of dark energy at the time was negligible.[22] It also constrained the content of the present-day universe; 4.6% atoms, 23% dark matter and 72% dark energy.[6]
The WMAP five-year data was combined with measurements from Type Ia supernova (SNe) and Baryon acoustic oscillations (BAO).[6]
The elliptical shape of the WMAP skymap is the result of a Mollweide projection.[23]
| Parameter | Symbol | Best fit (WMAP only) | Best fit (WMAP + SNe + BAO) |
|---|---|---|---|
| Age of the universe (Ga) | Template:Val | Template:Val | |
| Hubble's constant ( Template:Frac ) | Template:Val | Template:Val | |
| Baryonic content | Template:Val | Template:Val | |
| Cold dark matter content | Template:Val | Template:Val | |
| Dark energy content | Template:Val | Template:Val | |
| Optical depth to reionization | Template:Val | Template:Val | |
| Scalar spectral index | Template:Val | Template:Val | |
| Running of spectral index | Template:Val | Template:Val | |
| Fluctuation amplitude at 8h−1 Mpc | Template:Val | Template:Val | |
| Total density of the universe | Template:Val | Template:Val | |
| Tensor-to-scalar ratio | r | < 0.43 | < 0.22 |


The data puts a limits on the value of the tensor-to-scalar ratio, r < 0.22 (95% certainty), which determines the level at which gravitational waves affect the polarization of the CMB, and also puts limits on the amount of primordial non-gaussianity. Improved constraints were put on the redshift of reionization, which is Template:Val, the redshift of decoupling, Template:Val (as well as age of universe at decoupling, Template:Val) and the redshift of matter/radiation equality, Template:Val.[6]
The extragalactic source catalogue was expanded to include 390 sources, and variability was detected in the emission from Mars and Saturn.[6]
 |
 |
 |
 |

|
| 23 GHz | 33 GHz | 41 GHz | 61 GHz | 94 GHz |
Seven-year data release[]
| File:Commons-Logo.svg | Wikimedia Commons has media related to Category:WMAP 7-year results. |

7-year WMAP image of background cosmic radiation (2010).
The Seven-year WMAP data were released on January 26, 2010. As part of this release, claims for inconsistencies with the standard model were investigated.[24] Most were shown not to be statistically significant, and likely due to a posteriori selection (where one sees a weird deviation, but fails to consider properly how hard one has been looking; a deviation with 1:1000 likelihood will typically be found if one tries one thousand times). For the deviations that do remain, there are no alternative cosmological ideas (for instance, there seem to be correlations with the ecliptic pole). It seems most likely these are due to other effects, with the report mentioning uncertainties in the precise beam shape and other possible small remaining instrumental and analysis issues.
The other confirmation of major significance is of the total amount of matter/energy in the Universe in the form of Dark Energy – 72.8% (within 1.6%) as non 'particle' background, and Dark Matter – 22.7% (within 1.4%) of non baryonic (sub atomic) 'particle' energy. This leaves matter, or baryonic particles (atoms) at only 4.56% (within 0.16%).
| Parameter | Symbol | Best fit (WMAP only) | Best fit (WMAP + BAO[26] + H0[27]) |
|---|---|---|---|
| Age of the universe (Ga) | Template:Val | Template:Val | |
| Hubble's constant ( Template:Frac ) | Template:Val | Template:Val | |
| Baryon density | Template:Val | Template:Val | |
| Physical baryon density | Template:Val | Template:Val | |
| Dark matter density | Template:Val | Template:Val | |
| Physical dark matter density | Template:Val | Template:Val | |
| Dark energy density | Template:Val | Template:Val | |
| Fluctuation amplitude at 8h−1 Mpc | Template:Val | Template:Val | |
| Scalar spectral index | Template:Val | Template:Val | |
| Reionization optical depth | Template:Val | Template:Val | |
| *Total density of the universe | Template:Val | Template:Val | |
| *Tensor-to-scalar ratio, k0 = 0.002 Mpc−1 | r | < 0.36 (95% CL) | < 0.24 (95% CL) |
| *Running of spectral index, k0 = 0.002 Mpc−1 | Template:Val | Template:Val | |
| Note: * = Parameters for extended models (parameters place limits on deviations from the Lambda-CDM model)[25] |


 |
 |
 |
 |

|
| 23 GHz | 33 GHz | 41 GHz | 61 GHz | 94 GHz |
Nine-year data release[]
| File:Commons-Logo.svg | Wikimedia Commons has media related to Category:WMAP results. |


9-year WMAP image of background cosmic radiation (2012).
On December 20, 2012, the Nine-year WMAP data and related images were released. Template:Val billion-year-old temperature fluctuations and a temperature range of ± 200 micro-Kelvin are shown in the image. In addition, the study found that "95-percent" of the early universe is composed of dark matter and energy, the curvature of space is less than 0.4 percent of "flat" and the universe emerged from the cosmic Dark Ages "about 400 million years" after the Big Bang.[11][12][28]
| Parameter | Symbol | Best fit (WMAP only) | Best fit (WMAP + eCMB + BAO + H0) |
|---|---|---|---|
| Age of the universe (Ga) | Template:Val | Template:Val | |
| Hubble's constant ( Template:Frac ) | Template:Val | Template:Val | |
| Baryon density | Template:Val | Template:Val | |
| Physical baryon density | Template:Val | Template:Val | |
| Cold Dark matter density | Template:Val | Template:Val | |
| Physical cold dark matter density | Template:Val | Template:Val | |
| Dark energy density | Template:Val | Template:Val | |
| Density fluctuations at 8h−1 Mpc | Template:Val | Template:Val | |
| Scalar spectral index | Template:Val | Template:Val | |
| Reionization optical depth | Template:Val | Template:Val | |
| Curvature | 1 | Template:Val | Template:Val |
| Tensor-to-scalar ratio (k0 = 0.002 Mpc−1) | r | < 0.38 (95% CL) | < 0.13 (95% CL) |
| Running scalar spectral index | Template:Val | Template:Val |


Main result[]
Interviews with Dr. Charles Bennett and Dr. Lyman Page about WMAP.
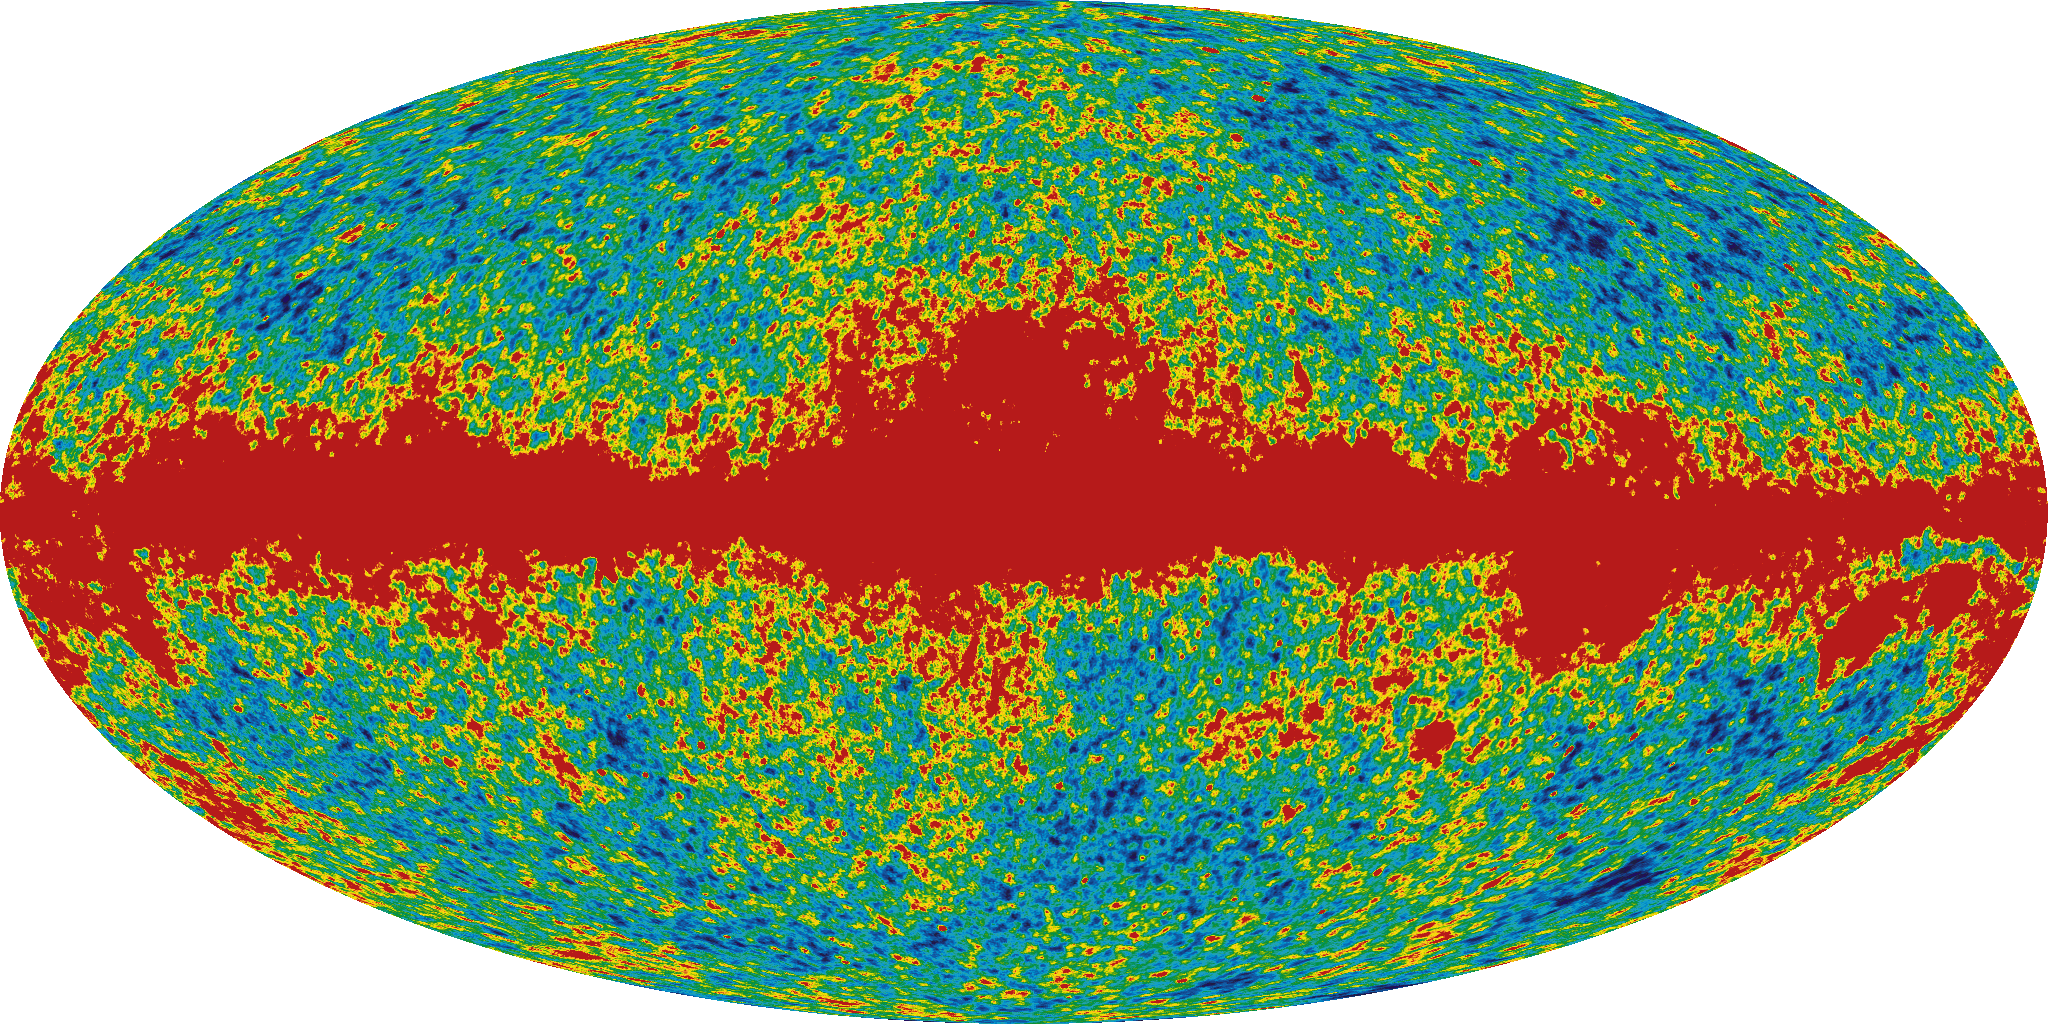
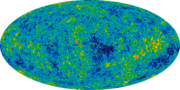
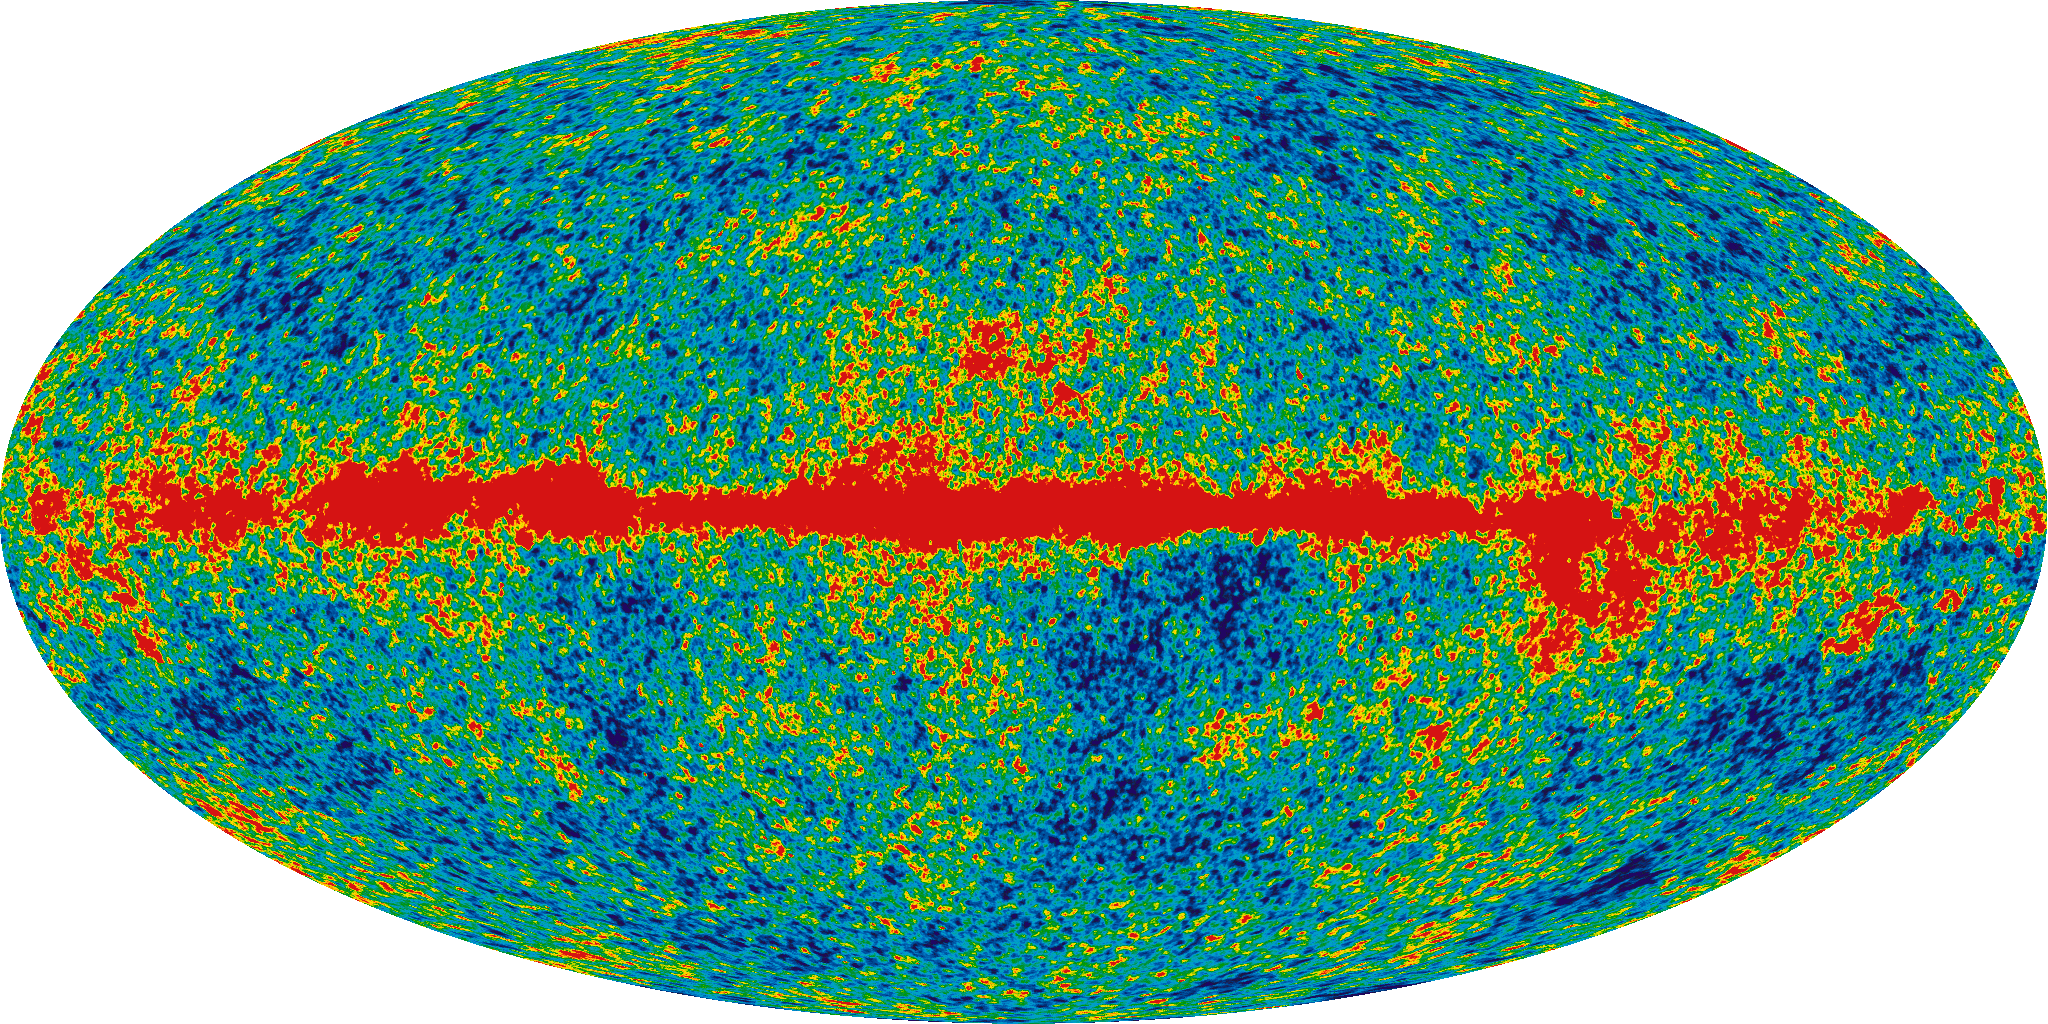
The main result of the mission is contained in the various oval maps of the CMB spectrum over the years. These oval images present the temperature distribution gained by the WMAP team from the observations by the telescope of the mission. Measured is the temperature obtained from a Planck's law interpretation of the microwave background. The oval map covers the whole sky. The results describe the state of the universe only some hundred-thousand years after the Big Bang, which happened roughly 13.8 billion years before our time. The microwave background is very homogeneous in temperature (the relative variations from the mean, which presently is still 2.7 kelvins, are only of the order of 5x10⁻⁵. The temperature variations corresponding to the local directions are presented through different colours (the "red" directions are hotter, the "blue" directions cooler than the average).
Follow-on missions and future measurements[]
The original timeline for WMAP gave it two years of observations; these were completed by September 2003. Mission extensions were granted in 2002, 2004, 2006, and 2008 giving the spacecraft a total of 9 observing years, which ended August 2010[16] and in October 2010 the spacecraft was moved to a heliocentric "graveyard" orbit[10] outside L2, in which it orbits the Sun 14 times every 15 years.[citation needed]


Comparison of CMB results from COBE, WMAP and Planck – March 21, 2013.
The Planck spacecraft, launched on May 14, 2009, also measures the CMB and aims to refine the measurements made by WMAP, both in total intensity and polarization. Various ground- and balloon-based instruments have also made CMB contributions, and others are being constructed to do so. Many are aimed at searching for the B-mode polarization expected from the simplest models of inflation, including EBEX, Spider, BICEP2, Keck, QUIET, CLASS, SPTpol and others.
On 21 March 2013, the European-led research team behind the Planck cosmology probe released the mission's all-sky map of the cosmic microwave background.[29][30] The map suggests the universe is slightly older than thought. According to the map, subtle fluctuations in temperature were imprinted on the deep sky when the cosmos was about 370,000 years old. The imprint reflects ripples that arose as early, in the existence of the universe, as the first nonillionth (10−30) of a second. Apparently, these ripples gave rise to the present vast cosmic web of galaxy clusters and dark matter. Based on the 2013 data, the universe contains 4.9% ordinary matter, 26.8% dark matter and 68.3% dark energy. On 5 February 2015, new data was released by the Planck mission, according to which the age of the universe is 13.799 ± 0.021 billion years old and the Hubble constant was measured to be 67.74 ± 0.46 (km/s)/Mpc.[31]
See also[]
- European Space Agency Planck (spacecraft)
- Illustris project
- List of cosmic microwave background experiments
- List of cosmological computation software
Further reading[]
- Wilkinson Microwave Anisotrophy Probe Charles L. Bennett Scholarpedia, 2(10):4731. doi:10.4249/scholarpedia.4731
References[]
Footnotes[]
- ↑ "Wilkinson Microwave Anisotropy Probe: Overview". Legacy Archive for Background Data Analysis (LAMBDA). Greenbelt, Maryland: NASA's High Energy Astrophysics Science Archive Research Center (HEASARC). August 4, 2009. http://lambda.gsfc.nasa.gov/product/map/current/. Retrieved September 24, 2009. "The WMAP (Wilkinson Microwave Anisotropy Probe) mission is designed to determine the geometry, content, and evolution of the universe via a 13 arcminute FWHM resolution full sky map of the temperature anisotropy of the cosmic microwave background radiation."
- ↑ "Tests of Big Bang: The CMB". Universe 101: Our Universe. NASA. July 2009. http://map.gsfc.nasa.gov/universe/bb_tests_cmb.html. Retrieved September 24, 2009. "Only with very sensitive instruments, such as COBE and WMAP, can cosmologists detect fluctuations in the cosmic microwave background temperature. By studying these fluctuations, cosmologists can learn about the origin of galaxies and large scale structures of galaxies and they can measure the basic parameters of the Big Bang theory."
- ↑ 3.0 3.1 3.2 "New image of infant universe reveals era of first stars, age of cosmos, and more". NASA / WMAP team. February 11, 2003. Archived from the original on February 27, 2008. https://web.archive.org/web/20080227175308/http://www.gsfc.nasa.gov/topstory/2003/0206mapresults.html. Retrieved April 27, 2008.
- ↑ Template:Cite book
- ↑ J. Beringer et al. (Particle Data Group), Phys. Rev. D86, 010001 (2012) and 2013 partial update for the 2014 edition. [1]
- ↑ 6.0 6.1 6.2 6.3 6.4 6.5 6.6 6.7 6.8 Hinshaw et al. (2009)
- ↑ Seife (2003)
- ↑ ""Super Hot" Papers in Science". in-cites. October 2005. http://www.in-cites.com/hotpapers/shp/1-50.html. Retrieved April 26, 2008.
- ↑ "Announcement of the Shaw Laureates 2010". Archived from the original on June 4, 2010. https://web.archive.org/20100604044215/http://www.shawprize.org:80/en/shawprize2010/announcement/announcement.html.
- ↑ 10.0 10.1 Template:Cite news
- ↑ 11.0 11.1 Gannon, Megan (December 21, 2012). "New 'Baby Picture' of Universe Unveiled". Space.com. http://www.space.com/19027-universe-baby-picture-wmap.html. Retrieved December 21, 2012.
- ↑ 12.0 12.1 12.2 Template:Cite journal
- ↑ O'Dwyer et al., 2004. The Astrophysical Journal, Volume 617, Issue 2, pp. L99-L102. [2]
- ↑ 14.00 14.01 14.02 14.03 14.04 14.05 14.06 14.07 14.08 14.09 14.10 14.11 14.12 14.13 14.14 Bennett et al. (2003a)
- ↑ 15.0 15.1 Bennett et al. (2003b)
- ↑ 16.0 16.1 16.2 16.3 16.4 "WMAP News: Facts". NASA. April 22, 2008. http://map.gsfc.nasa.gov/news/facts.html. Retrieved April 27, 2008.
- ↑ 17.0 17.1 "WMAP News: Events". NASA. April 17, 2008. http://map.gsfc.nasa.gov/news/events.html. Retrieved April 27, 2008.
- ↑ 18.0 18.1 18.2 Limon et al. (2008)
- ↑ 19.0 19.1 19.2 Spergel et al. (2003)
- ↑ 20.0 20.1 20.2 Spergel et al. (2007)
- ↑ Hinshaw et al. (2007)
- ↑ 22.0 22.1 "WMAP Press Release — WMAP reveals neutrinos, end of dark ages, first second of universe". NASA / WMAP team. March 7, 2008. http://map.gsfc.nasa.gov/news/. Retrieved April 27, 2008.
- ↑ WMAP 1-year Paper Figures, Bennett, et al.
- ↑ [3] Seven-Year Wilkinson Microwave Anisotropy Probe (WMAP) Observations: Are There Cosmic Microwave Background Anomalies?
- ↑ 25.0 25.1 Table 8 on p. 39 of Jarosik, N.. "Seven-Year Wilkinson Microwave Anisotropy Probe (WMAP) Observations: Sky Maps, Systematic Errors, and Basic Results" (PDF). nasa.gov. http://lambda.gsfc.nasa.gov/product/map/dr4/pub_papers/sevenyear/basic_results/wmap_7yr_basic_results.pdf. Retrieved December 4, 2010. (from NASA's WMAP Documents page)
- ↑ Template:Cite journal
- ↑ Riess, Adam G.. "A Redetermination of the Hubble Constant with the Hubble Space Telescope from a Differential Distance Ladder" (PDF). hubblesite.org. http://hubblesite.org/pubinfo/pdf/2009/08/pdf.pdf. Retrieved December 4, 2010.
- ↑ Hinshaw et al., 2013
- ↑ Clavin, Whitney; Harrington, J.D. (21 March 2013). "Planck Mission Brings Universe Into Sharp Focus". NASA. http://www.jpl.nasa.gov/news/news.php?release=2013-109&rn=news.xml&rst=3739. Retrieved 21 March 2013.
- ↑ Template:Cite news
- ↑ Template:Cite journal
Primary sources[]
- Template:Cite journal
- Template:Cite journal
- Template:Cite journal
- Template:Cite journal
- Limon, M. (March 20, 2008). "Wilkinson Microwave Anisotropy Probe (WMAP): Five–Year Explanatory Supplement" (PDF). http://lambda.gsfc.nasa.gov/product/map/dr3/pub_papers/fiveyear/supplement/WMAP_supplement.pdf.
- Template:Cite journal
- Template:Cite journal
- Template:Cite journal
- Template:Cite journal
External links[]
| File:Commons-Logo.svg | Wikimedia Commons has media related to WMAP. |
- Sizing up the universe
- About WMAP and the Cosmic Microwave Background – Article at Space.com
- Big Bang glow hints at funnel-shaped Universe, NewScientist, April 15, 2004
- NASA March 16, 2006 WMAP inflation related press release
- Template:Cite journal
Template:CMB experiments
| |||||||||||||||||||||||
Template:Space observatories
| |||||||||||||||||||||||||||||||||||||||||
| This page uses Creative Commons Licensed content from Wikipedia (view authors). | 
|